PDF Publication Title:
Text from PDF Page: 062
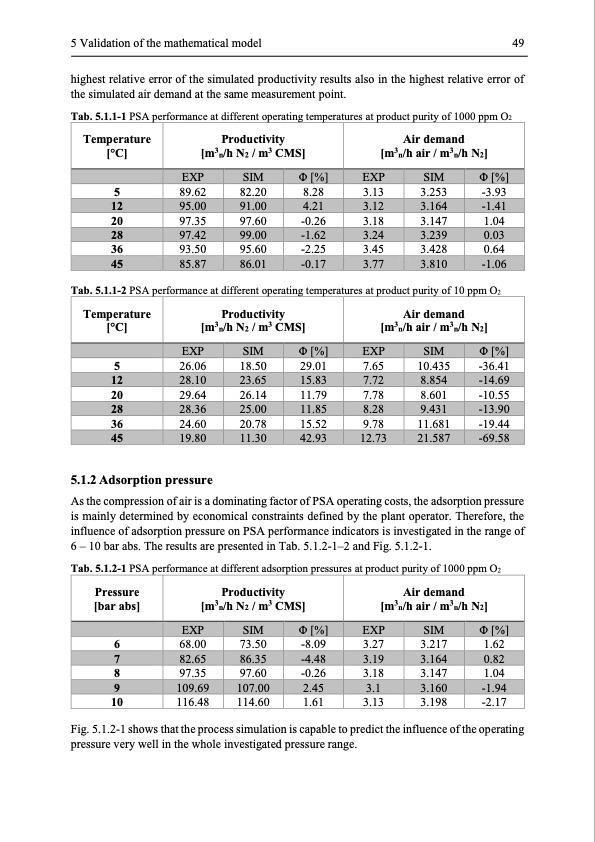
5 Validation of the mathematical model 49 highest relative error of the simulated productivity results also in the highest relative error of the simulated air demand at the same measurement point. Tab. 5.1.1-1 PSA performance at different operating temperatures at product purity of 1000 ppm O2 Temperature [°C] Productivity [m3n/h N2 / m3 CMS] Air demand [m3n/h air / m3n/h N2] EXP SIM Φ [%] EXP SIM Φ [%] 5 89.62 20 97.35 36 93.50 82.20 8.28 97.60 -0.26 95.60 -2.25 3.13 3.253 -3.93 3.18 3.147 1.04 3.45 3.428 0.64 12 95.00 91.00 4.21 3.12 3.164 -1.41 28 97.42 99.00 -1.62 3.24 3.239 0.03 45 85.87 86.01 -0.17 3.77 3.810 -1.06 Tab. 5.1.1-2 PSA performance at different operating temperatures at product purity of 10 ppm O2 Temperature [°C] Productivity [m3n/h N2 / m3 CMS] Air demand [m3n/h air / m3n/h N2] EXP SIM Φ [%] EXP SIM Φ [%] 5 26.06 18.50 20 29.64 26.14 36 24.60 20.78 5.1.2 Adsorption pressure 29.01 7.65 10.435 11.79 7.78 8.601 15.52 9.78 11.681 -36.41 -10.55 -19.44 12 28.10 23.65 15.83 7.72 8.854 -14.69 28 28.36 25.00 11.85 8.28 9.431 -13.90 45 19.80 11.30 42.93 12.73 21.587 -69.58 As the compression of air is a dominating factor of PSA operating costs, the adsorption pressure is mainly determined by economical constraints defined by the plant operator. Therefore, the influence of adsorption pressure on PSA performance indicators is investigated in the range of 6 – 10 bar abs. The results are presented in Tab. 5.1.2-1–2 and Fig. 5.1.2-1. Tab. 5.1.2-1 PSA performance at different adsorption pressures at product purity of 1000 ppm O2 Pressure [bar abs] Productivity [m3n/h N2 / m3 CMS] Air demand [m3n/h air / m3n/h N2] EXP SIM Φ [%] EXP SIM Φ [%] 6 68.00 73.50 -8.09 3.27 8 97.35 97.60 -0.26 3.18 10 116.48 114.60 1.61 3.13 3.217 1.62 3.147 1.04 3.198 -2.17 7 82.65 86.35 -4.48 3.19 3.164 0.82 9 109.69 107.00 2.45 3.1 3.160 -1.94 Fig. 5.1.2-1 shows that the process simulation is capable to predict the influence of the operating pressure very well in the whole investigated pressure range.PDF Image | Modelling and Simulation of Twin-Bed Pressure Swing Adsorption Plants
PDF Search Title:
Modelling and Simulation of Twin-Bed Pressure Swing Adsorption PlantsOriginal File Name Searched:
dissertation_marcinek.pdfDIY PDF Search: Google It | Yahoo | Bing
CO2 Organic Rankine Cycle Experimenter Platform The supercritical CO2 phase change system is both a heat pump and organic rankine cycle which can be used for those purposes and as a supercritical extractor for advanced subcritical and supercritical extraction technology. Uses include producing nanoparticles, precious metal CO2 extraction, lithium battery recycling, and other applications... More Info
Heat Pumps CO2 ORC Heat Pump System Platform More Info
| CONTACT TEL: 608-238-6001 Email: greg@infinityturbine.com | RSS | AMP |