PDF Publication Title:
Text from PDF Page: 078
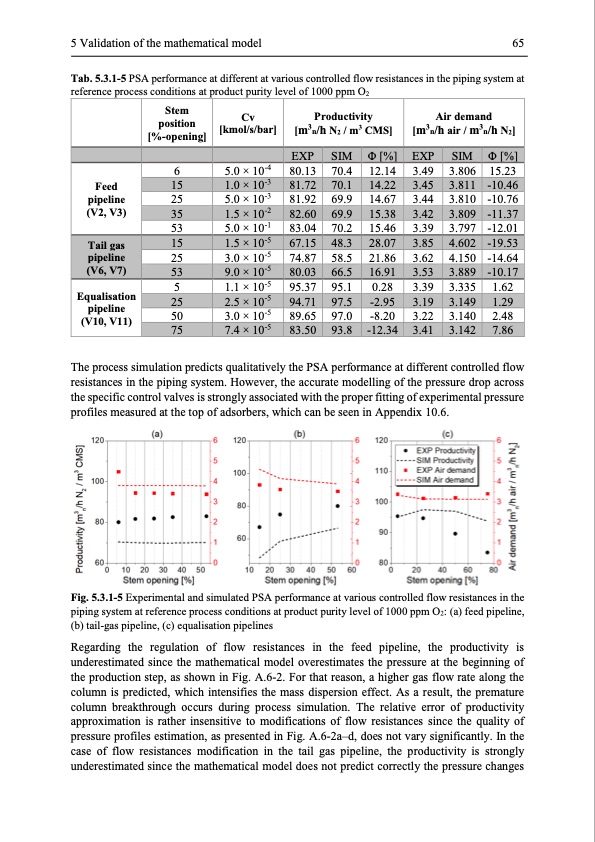
5 Validation of the mathematical model 65 Tab. 5.3.1-5 PSA performance at different at various controlled flow resistances in the piping system at reference process conditions at product purity level of 1000 ppm O2 Stem position [%-opening] Cv [kmol/s/bar] Productivity [m3n/h N2 / m3 CMS] Air demand [m3n/h air / m3n/h N2] EXP SIM Φ [%] EXP SIM Φ [%] 6 5.0 × 10⁻⁴ Feed pipeline 25 (V2, V3) Equalisation pipeline (V10, V11) 80.13 70.4 81.92 69.9 83.04 70.2 74.87 58.5 95.37 95.1 89.65 97.0 12.14 3.49 14.67 3.44 15.46 3.39 21.86 3.62 0.28 3.39 -8.20 3.22 3.806 3.810 3.797 4.150 3.335 3.140 15.23 -10.76 -12.01 -14.64 1.62 2.48 15 1.0 × 10⁻³ 81.72 70.1 14.22 3.45 3.811 -10.46 5.0 × 10⁻³ 53 5.0 × 10⁻¹ 25 3.0 × 10⁻⁵ 5 1.1 × 10⁻⁵ 50 3.0 × 10⁻⁵ 35 1.5 × 10⁻² 82.60 69.9 15.38 3.42 3.809 -11.37 1.5 × 10⁻⁵ Tail gas pipeline (V6, V7) 15 67.15 28.07 3.85 4.602 -19.53 9.0 × 10⁻⁵ 53 80.03 66.5 16.91 3.53 3.889 -10.17 25 2.5 × 10⁻⁵ 94.71 97.5 -2.95 3.19 3.149 1.29 75 7.4 × 10⁻⁵ 83.50 93.8 -12.34 3.41 3.142 7.86 The process simulation predicts qualitatively the PSA resistances in the piping system. However, the accurate modelling of the pressure drop across the specific control valves is strongly associated with the proper fitting of experimental pressure profiles measured at the top of adsorbers, which can be seen in Appendix 10.6. Fig. 5.3.1-5 Experimental and simulated PSA performance at various controlled flow resistances in the piping system at reference process conditions at product purity level of 1000 ppm O2: (a) feed pipeline, (b) tail-gas pipeline, (c) equalisation pipelines Regarding the regulation of flow resistances in the feed pipeline, the productivity is underestimated since the mathematical model overestimates the pressure at the beginning of the production step, as shown in Fig. A.6-2. For that reason, a higher gas flow rate along the column is predicted, which intensifies the mass dispersion effect. As a result, the premature column breakthrough occurs during process simulation. The relative error of productivity approximation is rather insensitive to modifications of flow resistances since the quality of pressure profiles estimation, as presented in Fig. A.6-2a–d, does not vary significantly. In the case of flow resistances modification in the tail gas pipeline, the productivity is strongly underestimated since the mathematical model does not predict correctly the pressure changes 48.3 performance at different controlled flowPDF Image | Modelling and Simulation of Twin-Bed Pressure Swing Adsorption Plants
PDF Search Title:
Modelling and Simulation of Twin-Bed Pressure Swing Adsorption PlantsOriginal File Name Searched:
dissertation_marcinek.pdfDIY PDF Search: Google It | Yahoo | Bing
CO2 Organic Rankine Cycle Experimenter Platform The supercritical CO2 phase change system is both a heat pump and organic rankine cycle which can be used for those purposes and as a supercritical extractor for advanced subcritical and supercritical extraction technology. Uses include producing nanoparticles, precious metal CO2 extraction, lithium battery recycling, and other applications... More Info
Heat Pumps CO2 ORC Heat Pump System Platform More Info
| CONTACT TEL: 608-238-6001 Email: greg@infinityturbine.com | RSS | AMP |