PDF Publication Title:
Text from PDF Page: 032
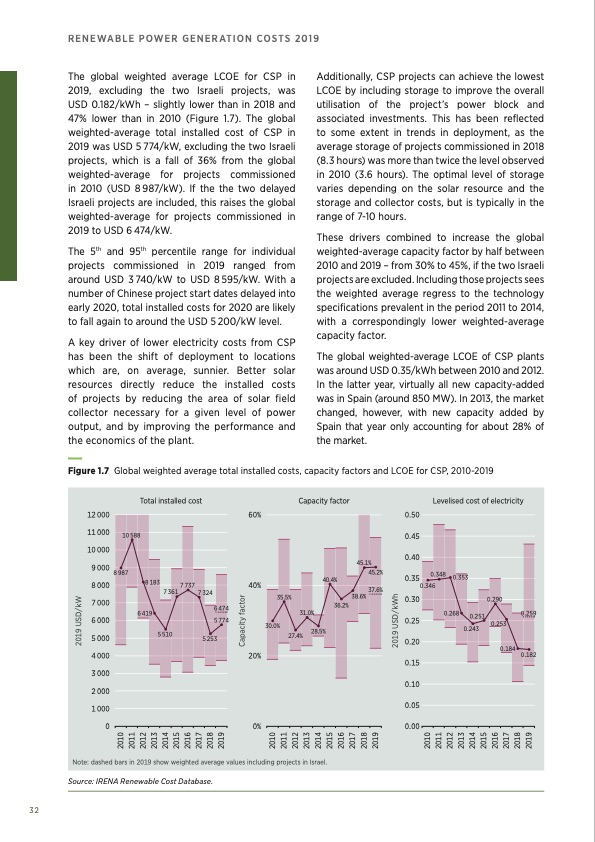
Total installed cost 12 000 60% Capacity factor Levelised cost of electricity 11 000 10 000 9 000 8000 7 000 6 000 5 000 4 000 3 000 2 000 1 000 0 10 588 8 987 0.50 0.45 0.40 45.1% 45.2% 0.35 8183 7737 40% 40.4% 36.2% 0.348 0.353 37.6% 0.346 61 5 510 7 324 5 253 35.5% 30.0% 38.6% 0.30 0.25 0.20 0.15 0.10 0.05 0.00 73 0.290 0.251 0.253 0.18 6 419 6 474 5 774 31.0% 0.268 0.259 0 4 0.182 27.4% 28.5% .243 20% 0% Note: dashed bars in 2019 show weighted average values including projects in Israel. RENEWABLE POWER GENERATION COSTS 2019 The global weighted average LCOE for CSP in 2019, excluding the two Israeli projects, was USD 0.182/kWh – slightly lower than in 2018 and 47% lower than in 2010 (Figure 1.7). The global weighted-average total installed cost of CSP in 2019 was USD 5 774/kW, excluding the two Israeli projects, which is a fall of 36% from the global weighted-average for projects commissioned in 2010 (USD 8987/kW). If the the two delayed Israeli projects are included, this raises the global weighted-average for projects commissioned in 2019 to USD 6 474/kW. The 5th and 95th percentile range for individual projects commissioned in 2019 ranged from around USD 3740/kW to USD 8595/kW. With a number of Chinese project start dates delayed into early 2020, total installed costs for 2020 are likely to fall again to around the USD 5 200/kW level. A key driver of lower electricity costs from CSP has been the shift of deployment to locations which are, on average, sunnier. Better solar resources directly reduce the installed costs of projects by reducing the area of solar field collector necessary for a given level of power output, and by improving the performance and the economics of the plant. Additionally, CSP projects can achieve the lowest LCOE by including storage to improve the overall utilisation of the project’s power block and associated investments. This has been reflected to some extent in trends in deployment, as the average storage of projects commissioned in 2018 (8.3 hours) was more than twice the level observed in 2010 (3.6 hours). The optimal level of storage varies depending on the solar resource and the storage and collector costs, but is typically in the range of 7-10 hours. These drivers combined to increase the global weighted-average capacity factor by half between 2010 and 2019 – from 30% to 45%, if the two Israeli projects are excluded. Including those projects sees the weighted average regress to the technology specifications prevalent in the period 2011 to 2014, with a correspondingly lower weighted-average capacity factor. The global weighted-average LCOE of CSP plants was around USD 0.35/kWh between 2010 and 2012. In the latter year, virtually all new capacity-added was in Spain (around 850 MW). In 2013, the market changed, however, with new capacity added by Spain that year only accounting for about 28% of the market. Figure 1.7 Global weighted average total installed costs, capacity factors and LCOE for CSP, 2010-2019 Source: IRENA Renewable Cost Database. 32 2010 2011 2012 2013 2014 2015 2016 2017 2018 2019 2010 2011 2012 2013 2014 2015 2016 2017 2018 2019 2010 2011 2012 2013 2014 2015 2016 2017 2018 2019 2019 USD/kW Capacity factor 2019 USD/kWhPDF Image | RENEWABLE POWER GENERATION COSTS IN 2019
PDF Search Title:
RENEWABLE POWER GENERATION COSTS IN 2019Original File Name Searched:
IRENA_Power_Generation_Costs_2019.pdfDIY PDF Search: Google It | Yahoo | Bing
NFT (Non Fungible Token): Buy our tech, design, development or system NFT and become part of our tech NFT network... More Info
IT XR Project Redstone NFT Available for Sale: NFT for high tech turbine design with one part 3D printed counter-rotating energy turbine. Be part of the future with this NFT. Can be bought and sold but only one design NFT exists. Royalties go to the developer (Infinity) to keep enhancing design and applications... More Info
Infinity Turbine IT XR Project Redstone Design: NFT for sale... NFT for high tech turbine design with one part 3D printed counter-rotating energy turbine. Includes all rights to this turbine design, including license for Fluid Handling Block I and II for the turbine assembly and housing. The NFT includes the blueprints (cad/cam), revenue streams, and all future development of the IT XR Project Redstone... More Info
Infinity Turbine ROT Radial Outflow Turbine 24 Design and Worldwide Rights: NFT for sale... NFT for the ROT 24 energy turbine. Be part of the future with this NFT. This design can be bought and sold but only one design NFT exists. You may manufacture the unit, or get the revenues from its sale from Infinity Turbine. Royalties go to the developer (Infinity) to keep enhancing design and applications... More Info
Infinity Supercritical CO2 10 Liter Extractor Design and Worldwide Rights: The Infinity Supercritical 10L CO2 extractor is for botanical oil extraction, which is rich in terpenes and can produce shelf ready full spectrum oil. With over 5 years of development, this industry leader mature extractor machine has been sold since 2015 and is part of many profitable businesses. The process can also be used for electrowinning, e-waste recycling, and lithium battery recycling, gold mining electronic wastes, precious metals. CO2 can also be used in a reverse fuel cell with nafion to make a gas-to-liquids fuel, such as methanol, ethanol and butanol or ethylene. Supercritical CO2 has also been used for treating nafion to make it more effective catalyst. This NFT is for the purchase of worldwide rights which includes the design. More Info
NFT (Non Fungible Token): Buy our tech, design, development or system NFT and become part of our tech NFT network... More Info
Infinity Turbine Products: Special for this month, any plans are $10,000 for complete Cad/Cam blueprints. License is for one build. Try before you buy a production license. May pay by Bitcoin or other Crypto. Products Page... More Info
| CONTACT TEL: 608-238-6001 Email: greg@infinityturbine.com | RSS | AMP |