PDF Publication Title:
Text from PDF Page: 008
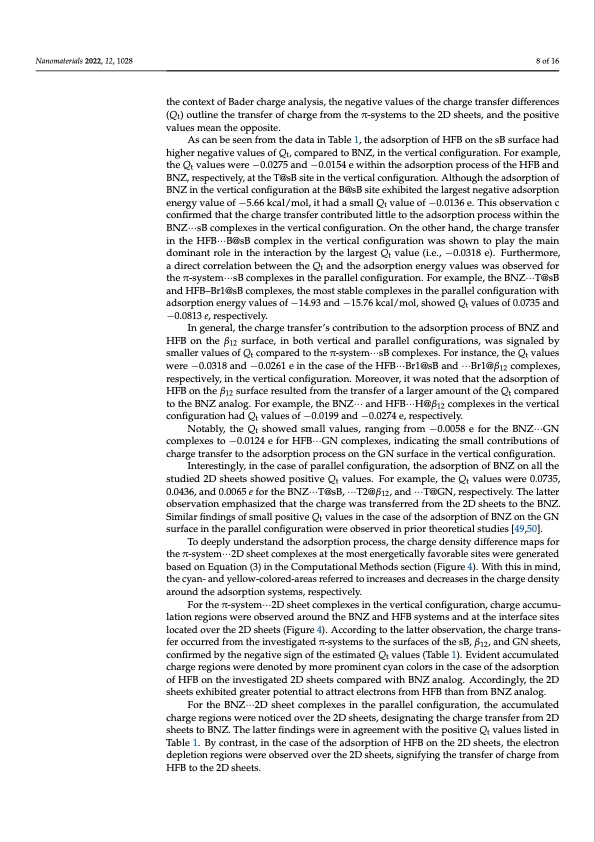
Nanomaterials 2022, 12, 1028 8 of 16 the context of Bader charge analysis, the negative values of the charge transfer differences (Qt) outline the transfer of charge from the π-systems to the 2D sheets, and the positive values mean the opposite. As can be seen from the data in Table 1, the adsorption of HFB on the sB surface had higher negative values of Qt, compared to BNZ, in the vertical configuration. For example, the Qt values were −0.0275 and −0.0154 e within the adsorption process of the HFB and BNZ, respectively, at the T@sB site in the vertical configuration. Although the adsorption of BNZ in the vertical configuration at the B@sB site exhibited the largest negative adsorption energy value of −5.66 kcal/mol, it had a small Qt value of −0.0136 e. This observation c confirmed that the charge transfer contributed little to the adsorption process within the BNZ···sB complexes in the vertical configuration. On the other hand, the charge transfer in the HFB···B@sB complex in the vertical configuration was shown to play the main dominant role in the interaction by the largest Qt value (i.e., −0.0318 e). Furthermore, a direct correlation between the Qt and the adsorption energy values was observed for the π-system···sB complexes in the parallel configuration. For example, the BNZ···T@sB and HFB–Br1@sB complexes, the most stable complexes in the parallel configuration with adsorption energy values of −14.93 and −15.76 kcal/mol, showed Qt values of 0.0735 and −0.0813 e, respectively. In general, the charge transfer’s contribution to the adsorption process of BNZ and HFB on the β12 surface, in both vertical and parallel configurations, was signaled by smaller values of Qt compared to the π-system···sB complexes. For instance, the Qt values were −0.0318 and −0.0261 e in the case of the HFB···Br1@sB and ···Br1@β12 complexes, respectively, in the vertical configuration. Moreover, it was noted that the adsorption of HFB on the β12 surface resulted from the transfer of a larger amount of the Qt compared to the BNZ analog. For example, the BNZ··· and HFB···H@β12 complexes in the vertical configuration had Qt values of −0.0199 and −0.0274 e, respectively. Notably, the Qt showed small values, ranging from −0.0058 e for the BNZ···GN complexes to −0.0124 e for HFB···GN complexes, indicating the small contributions of charge transfer to the adsorption process on the GN surface in the vertical configuration. Interestingly, in the case of parallel configuration, the adsorption of BNZ on all the studied 2D sheets showed positive Qt values. For example, the Qt values were 0.0735, 0.0436, and 0.0065 e for the BNZ···T@sB, ···T2@β12, and ···T@GN, respectively. The latter observation emphasized that the charge was transferred from the 2D sheets to the BNZ. Similar findings of small positive Qt values in the case of the adsorption of BNZ on the GN surface in the parallel configuration were observed in prior theoretical studies [49,50]. To deeply understand the adsorption process, the charge density difference maps for the π-system···2D sheet complexes at the most energetically favorable sites were generated based on Equation (3) in the Computational Methods section (Figure 4). With this in mind, the cyan- and yellow-colored-areas referred to increases and decreases in the charge density around the adsorption systems, respectively. For the π-system···2D sheet complexes in the vertical configuration, charge accumu- lation regions were observed around the BNZ and HFB systems and at the interface sites located over the 2D sheets (Figure 4). According to the latter observation, the charge trans- fer occurred from the investigated π-systems to the surfaces of the sB, β12, and GN sheets, confirmed by the negative sign of the estimated Qt values (Table 1). Evident accumulated charge regions were denoted by more prominent cyan colors in the case of the adsorption of HFB on the investigated 2D sheets compared with BNZ analog. Accordingly, the 2D sheets exhibited greater potential to attract electrons from HFB than from BNZ analog. For the BNZ···2D sheet complexes in the parallel configuration, the accumulated charge regions were noticed over the 2D sheets, designating the charge transfer from 2D sheets to BNZ. The latter findings were in agreement with the positive Qt values listed in Table 1. By contrast, in the case of the adsorption of HFB on the 2D sheets, the electron depletion regions were observed over the 2D sheets, signifying the transfer of charge from HFB to the 2D sheets.PDF Image | Borophene and Pristine Graphene 2D Sheets
PDF Search Title:
Borophene and Pristine Graphene 2D SheetsOriginal File Name Searched:
nanomaterials-12-01028-v2.pdfDIY PDF Search: Google It | Yahoo | Bing
CO2 Organic Rankine Cycle Experimenter Platform The supercritical CO2 phase change system is both a heat pump and organic rankine cycle which can be used for those purposes and as a supercritical extractor for advanced subcritical and supercritical extraction technology. Uses include producing nanoparticles, precious metal CO2 extraction, lithium battery recycling, and other applications... More Info
Heat Pumps CO2 ORC Heat Pump System Platform More Info
| CONTACT TEL: 608-238-6001 Email: greg@infinityturbine.com | RSS | AMP |