PDF Publication Title:
Text from PDF Page: 008
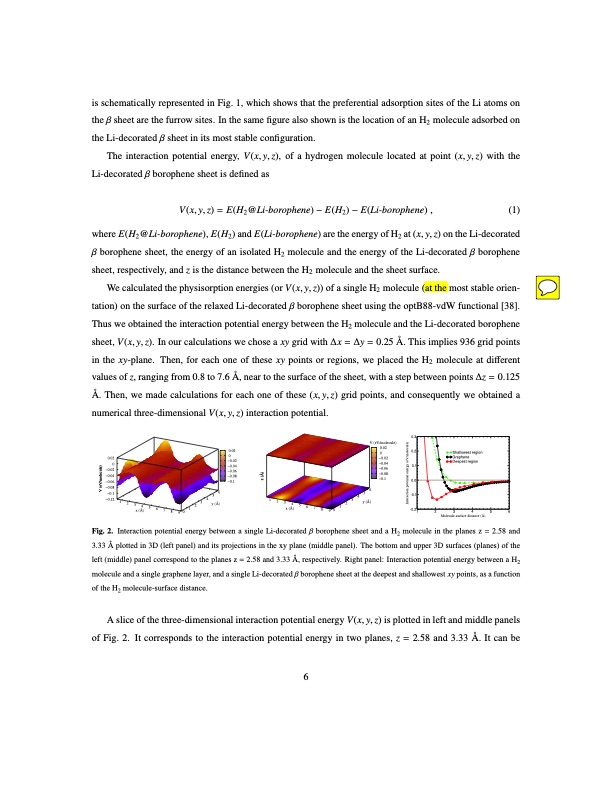
is schematically represented in Fig. 1, which shows that the preferential adsorption sites of the Li atoms on the β sheet are the furrow sites. In the same figure also shown is the location of an H2 molecule adsorbed on the Li-decorated β sheet in its most stable configuration. The interaction potential energy, V(x,y,z), of a hydrogen molecule located at point (x,y,z) with the Li-decorated β borophene sheet is defined as V(x, y, z) = E(H2@Li-borophene) − E(H2) − E(Li-borophene) , (1) where E(H2@Li-borophene), E(H2) and E(Li-borophene) are the energy of H2 at (x, y, z) on the Li-decorated β borophene sheet, the energy of an isolated H2 molecule and the energy of the Li-decorated β borophene sheet, respectively, and z is the distance between the H2 molecule and the sheet surface. We calculated the physisorption energies (or V(x, y, z)) of a single H2 molecule (at the most stable orien- tation) on the surface of the relaxed Li-decorated β borophene sheet using the optB88-vdW functional [38]. Thus we obtained the interaction potential energy between the H2 molecule and the Li-decorated borophene sheet, V(x, y, z). In our calculations we chose a xy grid with ∆x = ∆y = 0.25 Å. This implies 936 grid points in the xy-plane. Then, for each one of these xy points or regions, we placed the H2 molecule at different values of z, ranging from 0.8 to 7.6 Å, near to the surface of the sheet, with a step between points ∆z = 0.125 Å. Then, we made calculations for each one of these (x,y,z) grid points, and consequently we obtained a numerical three-dimensional V(x, y, z) interaction potential. 0.02 0 −0.02 −0.04 −0.06 −0.08 −0.1 −0.12 0 −0.02 1 2 3 4 x (Å) 5 6 7 8 9 0 1 3 4 2 y (Å) 1 2 3 x (Å) 1 2 0.02 V (eV/molecule) 0.02 0 −0.02 −0.04 −0.04 −0.06 −0.06 −0.08 −0.1 −0.08 −0.1 56 45 4 5 6 Fig. 2. Interaction potential energy between a single Li-decorated β borophene sheet and a H2 molecule in the planes z = 2.58 and 3.33 Å plotted in 3D (left panel) and its projections in the xy plane (middle panel). The bottom and upper 3D surfaces (planes) of the left (middle) panel correspond to the planes z = 2.58 and 3.33 Å, respectively. Right panel: Interaction potential energy between a H2 molecule and a single graphene layer, and a single Li-decorated β borophene sheet at the deepest and shallowest xy points, as a function of the H2 molecule-surface distance. A slice of the three-dimensional interaction potential energy V(x, y, z) is plotted in left and middle panels of Fig. 2. It corresponds to the interaction potential energy in two planes, z = 2.58 and 3.33 Å. It can be 6 6 3 y (Å) 7 8 9 0 0.3 0.2 0.1 0.0 -0.1 -0.21 2 3 4 5 6 Molecule-surface distance (Å) Shallowest region Graphene Deepest region V (eV/molecule) z (Å) Interaction potential energy (eV/molecule)PDF Image | Hydrogen storage capacity of Li-decorated borophene
PDF Search Title:
Hydrogen storage capacity of Li-decorated boropheneOriginal File Name Searched:
APSUSC-D-20-15170.pdfDIY PDF Search: Google It | Yahoo | Bing
CO2 Organic Rankine Cycle Experimenter Platform The supercritical CO2 phase change system is both a heat pump and organic rankine cycle which can be used for those purposes and as a supercritical extractor for advanced subcritical and supercritical extraction technology. Uses include producing nanoparticles, precious metal CO2 extraction, lithium battery recycling, and other applications... More Info
Heat Pumps CO2 ORC Heat Pump System Platform More Info
| CONTACT TEL: 608-238-6001 Email: greg@infinityturbine.com | RSS | AMP |