PDF Publication Title:
Text from PDF Page: 006
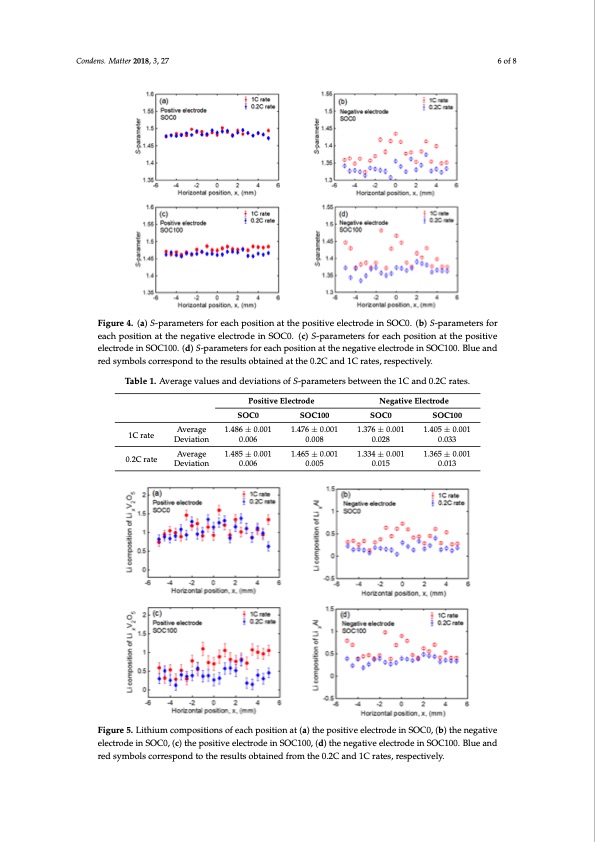
Condens. Matter 2018, 3, x FOR PEER REVIEW 6 of 8 the 1C rate is larger than that at the 0.2C rate. Therefore, inhomogeneous reactions are promoted Figure 4. (a) S-parameters for each position at the positive electrode in SOC0. (b) S-parameters for Figure 4. (a) S-parameters for each position at the positive electrode in SOC0. (b) S-parameters for each position at the negative electrode in SOC0. (c) S-parameters for each position at the positive each position at the negative electrode in SOC0. (c) S-parameters for each position at the positive electrode in SOC100. (d) S-parameters for each position at the negative electrode in SOC100. Blue and electrode in SOC100. (d) S-parameters for each position at the negative electrode in SOC100. Blue Condens. Matter 2018, 3, 27 during high charge–discharge speed. 6 of 8 red symbols correspond to the results obtained at the 0.2C and 1C rates, respectively. and red symbols correspond to the results obtained at the 0.2C and 1C rates, respectively. Table 1. Average values and deviations of S-parameters between the 1C and 0.2C rates. Table 1. Average values and deviations of S-parameters between the 1C and 0.2C rates. Positive Electrode Negative Electrode Positive Electrode Negative Electrode AveAravgeerage SSOOCC00 1.14.48866±±0.0.0011 SOC11000 1.4.47766±±0.0.0011 SOSCO0C0 1.317.637±60±.00.1001 SOCS1O00C100 1.4051.±4005.0±010.001 1C rat1eC rate Condens. Matter 20A18v,e3Ar,axvgeFerOaRgePEER1R.14E.48V85I5E±W±0.0.0011 Deviation 0.006 0.008 0.028 0.033 Deviation 0.006 0.008 1.4.46655±±0.0.0011 0.028 1.313.433±40±.00.1001 0.033 1.3651.±3605.0±010.0017 of 8 0.2C ra0.t2eC rate Deviation 0.006 0.005 0.015 0.013 Deviation 0.006 0.005 0.015 0.013 Figure 5. Lithium compositions of each position at (a) the positive electrode in SOC0, (b) the negative Figure 5. Lithium compositions of each position at (a) the positive electrode in SOC0, (b) the negative electrode in SOC0, (c) the positive electrode in SOC100, (d) the negative electrode in SOC100. Blue and electrode in SOC0, (c) the positive electrode in SOC100, (d) the negative electrode in SOC100. Blue red symbols correspond to the results obtained from the 0.2C and 1C rates, respectively. and red symbols correspond to the results obtained from the 0.2C and 1C rates, respectively. Table 2. Average values and deviations of the lithium composition for the 1C and 0.2C rates. 1C rate SOC0 Average 1.088 ± 0.028 Deviation 0.210 SOC100 0.738 ± 0.035 0.252 SOC0 0.412 ± 0.005 0.151 SOC100 0.566 ± 0.005 0.179 Positive Electrode Negative ElectrodePDF Image | Dependency of the Charge–Discharge Rate on Lithium Reaction Distributions
PDF Search Title:
Dependency of the Charge–Discharge Rate on Lithium Reaction DistributionsOriginal File Name Searched:
condensedmatter-03-00027.pdfDIY PDF Search: Google It | Yahoo | Bing
Sulfur Deposition on Carbon Nanofibers using Supercritical CO2 Sulfur Deposition on Carbon Nanofibers using Supercritical CO2. Gamma sulfur also known as mother of pearl sulfur and nacreous sulfur... More Info
CO2 Organic Rankine Cycle Experimenter Platform The supercritical CO2 phase change system is both a heat pump and organic rankine cycle which can be used for those purposes and as a supercritical extractor for advanced subcritical and supercritical extraction technology. Uses include producing nanoparticles, precious metal CO2 extraction, lithium battery recycling, and other applications... More Info
| CONTACT TEL: 608-238-6001 Email: greg@infinityturbine.com | RSS | AMP |