PDF Publication Title:
Text from PDF Page: 005
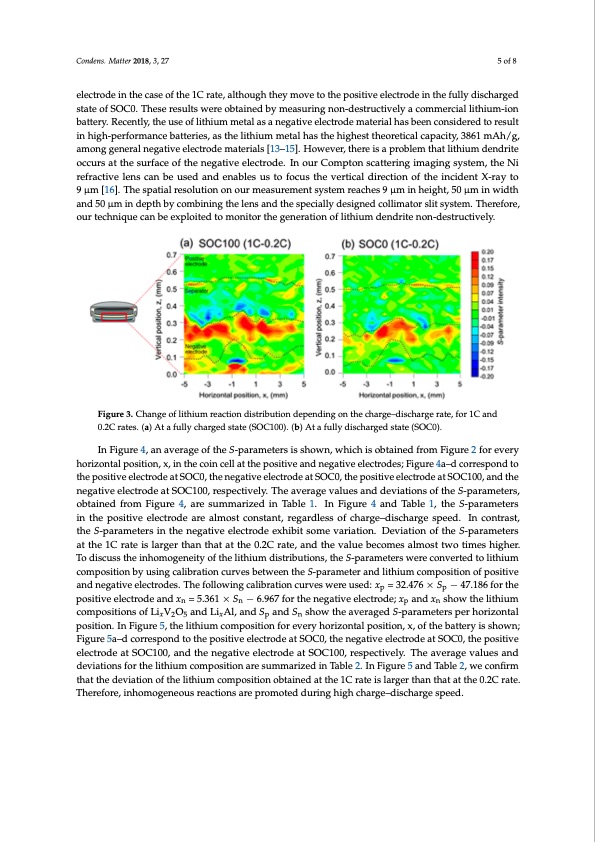
and SOC0, respectively. In Figure 3a, relatively vigorous lithium reactions occur at the surface of the negative electrode at the 1C rate. This trend of the lithium reactions occurring at the surface is the same as that reported in our previous study [4]. On the other hand, interestingly, when the battery was discharged at the 1C rate, as shown in Figure 3b, high S-parameter values appeared around the Condens. Matter 2018, 3, 27 5 of 8 horizontal position of x = −1 mm in the negative electrode. This means that the lithium ions remain in the negative electrode in the case of the 1C rate, although they move to the positive electrode in the fully discharged state of SOC0. These results were obtained by measuring non-destructively a electrode in the case of the 1C rate, although they move to the positive electrode in the fully discharged commercial lithium-ion battery. Recently, the use of lithium metal as a negative electrode material state of SOC0. These results were obtained by measuring non-destructively a commercial lithium-ion has been considered to result in high-performance batteries, as the lithium metal has the highest battery. Recently, the use of lithium metal as a negative electrode material has been considered to result theoretical capacity, 3861 mAh/g, among general negative electrode materials [13–15]. However, in high-performance batteries, as the lithium metal has the highest theoretical capacity, 3861 mAh/g, there is a problem that lithium dendrite occurs at the surface of the negative electrode. In our among general negative electrode materials [13–15]. However, there is a problem that lithium dendrite Compton scattering imaging system, the Ni refractive lens can be used and enables us to focus the occurs at the surface of the negative electrode. In our Compton scattering imaging system, the Ni vertical direction of the incident X-ray to 9 μm [16]. The spatial resolution on our measurement refractive lens can be used and enables us to focus the vertical direction of the incident X-ray to system reaches 9 μm in height, 50 μm in width and 50 μm in depth by combining the lens and the 9 μm [16]. The spatial resolution on our measurement system reaches 9 μm in height, 50 μm in width specially designed collimator slit system. Therefore, our technique can be exploited to monitor the and 50 μm in depth by combining the lens and the specially designed collimator slit system. Therefore, generation of lithium dendrite non-destructively. our technique can be exploited to monitor the generation of lithium dendrite non-destructively. Figure 3. Change of lithium reaction distribution depending on the charge–discharge rate, for 1C and Figure 3. Change of lithium reaction distribution depending on the charge–discharge rate, for 1C and 0.2C rates. (a) At a fully charged state (SOC100). (b) At a fully discharged state (SOC0). 0.2C rates. (a) At a fully charged state (SOC100). (b) At a fully discharged state (SOC0). In Figure 4, an average of the S-parameters is shown, which is obtained from Figure 2 for every In Figure 4, an average of the S-parameters is shown, which is obtained from Figure 2 for every horizontal position, x, in the coin cell at the positive and negative electrodes; Figure 4a–d correspond to horizontal position, x, in the coin cell at the positive and negative electrodes; Figure 4a–d correspond the positive electrode at SOC0, the negative electrode at SOC0, the positive electrode at SOC100, and the to the positive electrode at SOC0, the negative electrode at SOC0, the positive electrode at SOC100, negative electrode at SOC100, respectively. The average values and deviations of the S-parameters, and the negative electrode at SOC100, respectively. The average values and deviations of the obtained from Figure 4, are summarized in Table 1. In Figure 4 and Table 1, the S-parameters S-parameters, obtained from Figure 4, are summarized in Table 1. In Figure 4 and Table 1, in the positive electrode are almost constant, regardless of charge–discharge speed. In contrast, the S-parameters in the positive electrode are almost constant, regardless of charge–discharge speed. tIhnecSo-nptarraasmt,ettheersSi-npatrhaemneetegrastiivnetehlecntreogdaetiveexheilbeicttrsodmeeevxharibiaitiosonm.eDevvariaiatitoionn.ofDtehveiaSti-opnaroafmtehters aSt-tphaera1mCerteartseaist tlhareg1eCr trhaatenitshlatrgaetrththea0n.2tChartaatte,thaend0.2thCervatael,uaenbdetchoemveasluaelmboecsotmtwesoatlimoesthtiwgoher. Ttoimdeiscuhsigshthere. iTnhoodmisocguesnsetihtyeoifnthoemliothgieunmeitdyisotrfibthuetiolinths,iuthme Sd-ipstarriabmuteiotenrs, wtheereSc-opnavraemrtedtertos lwitherieum ccoomnpveorstietidontoblyithuisuinmgcoamlibproastitoinoncubryvuesibnegtwcaeleibnrtahtieoSn-cpuarvaemsebtertwaenednlittheiuSm-pacorampeotseirtiaondolfitphoiusimtive acnodmnpeogsaitivone eolefctprosdietisv. eThaendfolnloewgaintigvecaelilbercatrtioodnesc.urTvhees wfoelrleowusinedg: cxali=br3a2t.i4o7n6 c×urSves− w47e.r1e86ufsoerdt:he pp xp = 32.476 × Sp − 47.186 for the positive electrode and xn = 5.361 × Sn − 6.967 for the negative electrode; positive electrode and xn = 5.361 × Sn − 6.967 for the negative electrode; xp and xn show the lithium xp and xn show the lithium compositions of LixV2O5 and LixAl, and Sp and Sn show the averaged compositions of LixV2O5 and LixAl, and Sp and Sn show the averaged S-parameters per horizontal S-parameters per horizontal position. In Figure 5, the lithium composition for every horizontal position. In Figure 5, the lithium composition for every horizontal position, x, of the battery is shown; position, x, of the battery is shown; Figure 5a–d correspond to the positive electrode at SOC0, the Figure 5a–d correspond to the positive electrode at SOC0, the negative electrode at SOC0, the positive negative electrode at SOC0, the positive electrode at SOC100, and the negative electrode at SOC100, electrode at SOC100, and the negative electrode at SOC100, respectively. The average values and respectively. The average values and deviations for the lithium composition are summarized in deviations for the lithium composition are summarized in Table 2. In Figure 5 and Table 2, we confirm Table 2. In Figure 5 and Table 2, we confirm that the deviation of the lithium composition obtained at that the deviation of the lithium composition obtained at the 1C rate is larger than that at the 0.2C rate. Therefore, inhomogeneous reactions are promoted during high charge–discharge speed.PDF Image | Dependency of the Charge–Discharge Rate on Lithium Reaction Distributions
PDF Search Title:
Dependency of the Charge–Discharge Rate on Lithium Reaction DistributionsOriginal File Name Searched:
condensedmatter-03-00027.pdfDIY PDF Search: Google It | Yahoo | Bing
Sulfur Deposition on Carbon Nanofibers using Supercritical CO2 Sulfur Deposition on Carbon Nanofibers using Supercritical CO2. Gamma sulfur also known as mother of pearl sulfur and nacreous sulfur... More Info
CO2 Organic Rankine Cycle Experimenter Platform The supercritical CO2 phase change system is both a heat pump and organic rankine cycle which can be used for those purposes and as a supercritical extractor for advanced subcritical and supercritical extraction technology. Uses include producing nanoparticles, precious metal CO2 extraction, lithium battery recycling, and other applications... More Info
| CONTACT TEL: 608-238-6001 Email: greg@infinityturbine.com | RSS | AMP |