PDF Publication Title:
Text from PDF Page: 005
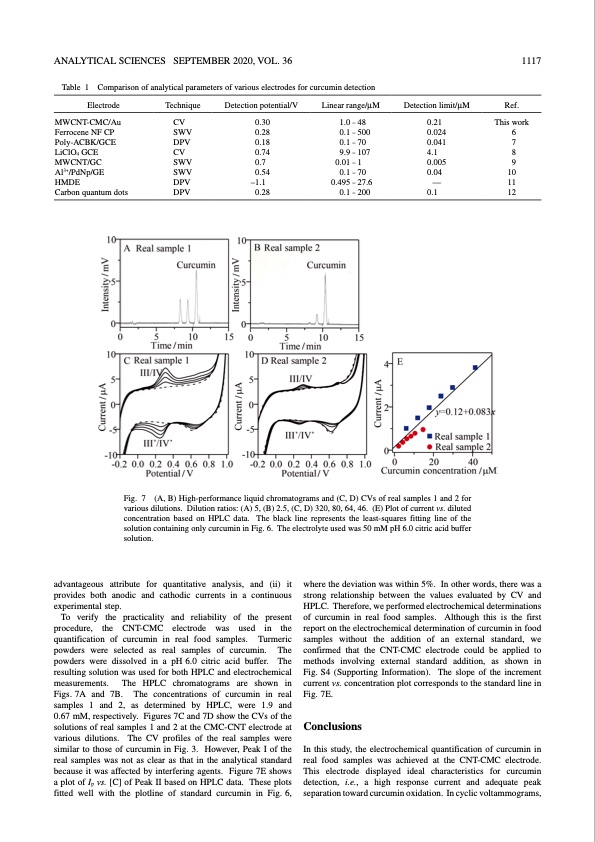
ANALYTICAL SCIENCES SEPTEMBER 2020, VOL. 36 1117 Table 1 Comparison of analytical parameters of various electrodes for curcumin detection Electrode MWCNT-CMC/Au Ferrocene NF CP Poly-ACBK/GCE LiClO4 GCE MWCNT/GC Al3+/PdNp/GE HMDE Carbon quantum dots Technique Detection potential/V CV 0.30 SWV 0.28 DPV 0.18 CV 0.74 SWV 0.7 SWV 0.54 DPV –1.1 DPV 0.28 Linear range/μM 1.0 – 48 0.1 – 500 0.1 – 70 9.9 – 107 0.01 – 1 0.1 – 70 0.495 – 27.6 0.1 – 200 Detection limit/μM Ref. 0.21 This work 0.024 6 0.041 7 4.1 8 0.005 9 0.04 10 — 11 0.1 12 Fig. 7 (A, B) High-performance liquid chromatograms and (C, D) CVs of real samples 1 and 2 for various dilutions. Dilution ratios: (A) 5, (B) 2.5, (C, D) 320, 80, 64, 46. (E) Plot of current vs. diluted concentration based on HPLC data. The black line represents the least-squares fitting line of the solution containing only curcumin in Fig. 6. The electrolyte used was 50 mM pH 6.0 citric acid buffer solution. advantageous attribute for quantitative analysis, and (ii) it provides both anodic and cathodic currents in a continuous experimental step. To verify the practicality and reliability of the present procedure, the CNT-CMC electrode was used in the quantification of curcumin in real food samples. Turmeric powders were selected as real samples of curcumin. The powders were dissolved in a pH 6.0 citric acid buffer. The resulting solution was used for both HPLC and electrochemical measurements. The HPLC chromatograms are shown in Figs. 7A and 7B. The concentrations of curcumin in real samples 1 and 2, as determined by HPLC, were 1.9 and 0.67 mM, respectively. Figures 7C and 7D show the CVs of the solutions of real samples 1 and 2 at the CMC-CNT electrode at various dilutions. The CV profiles of the real samples were similar to those of curcumin in Fig. 3. However, Peak I of the real samples was not as clear as that in the analytical standard because it was affected by interfering agents. Figure 7E shows a plot of Ip vs. [C] of Peak II based on HPLC data. These plots fitted well with the plotline of standard curcumin in Fig. 6, where the deviation was within 5%. In other words, there was a strong relationship between the values evaluated by CV and HPLC. Therefore, we performed electrochemical determinations of curcumin in real food samples. Although this is the first report on the electrochemical determination of curcumin in food samples without the addition of an external standard, we confirmed that the CNT-CMC electrode could be applied to methods involving external standard addition, as shown in Fig. S4 (Supporting Information). The slope of the increment currentvs.concentrationplotcorrespondstothestandardlinein Fig. 7E. Conclusions In this study, the electrochemical quantification of curcumin in real food samples was achieved at the CNT-CMC electrode. This electrode displayed ideal characteristics for curcumin detection, i.e., a high response current and adequate peak separation toward curcumin oxidation. In cyclic voltammograms,PDF Image | Electrochemical Detection of Curcumin
PDF Search Title:
Electrochemical Detection of CurcuminOriginal File Name Searched:
36_20P021.pdfDIY PDF Search: Google It | Yahoo | Bing
CO2 Organic Rankine Cycle Experimenter Platform The supercritical CO2 phase change system is both a heat pump and organic rankine cycle which can be used for those purposes and as a supercritical extractor for advanced subcritical and supercritical extraction technology. Uses include producing nanoparticles, precious metal CO2 extraction, lithium battery recycling, and other applications... More Info
Heat Pumps CO2 ORC Heat Pump System Platform More Info
| CONTACT TEL: 608-238-6001 Email: greg@infinityturbine.com | RSS | AMP |