PDF Publication Title:
Text from PDF Page: 004
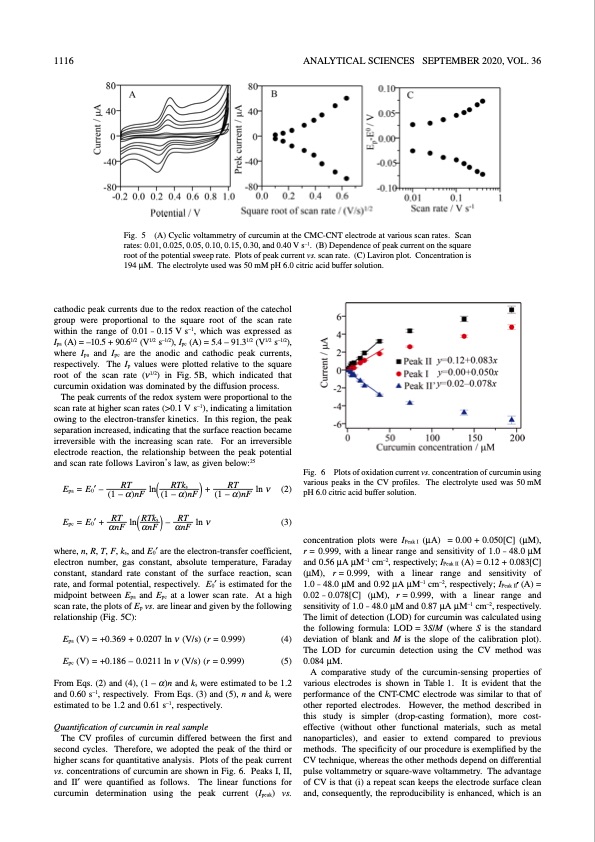
1116 ANALYTICAL SCIENCES SEPTEMBER 2020, VOL. 36 Fig. 5 (A) Cyclic voltammetry of curcumin at the CMC-CNT electrode at various scan rates. Scan rates: 0.01, 0.025, 0.05, 0.10, 0.15, 0.30, and 0.40 V s–1. (B) Dependence of peak current on the square root of the potential sweep rate. Plots of peak current vs. scan rate. (C) Laviron plot. Concentration is 194 μM. The electrolyte used was 50 mM pH 6.0 citric acid buffer solution. cathodic peak currents due to the redox reaction of the catechol group were proportional to the square root of the scan rate within the range of 0.01 – 0.15 V s–1, which was expressed as Ipa (A) = –10.5 + 90.61/2 (V1/2 s–1/2), Ipc (A) = 5.4 – 91.31/2 (V1/2 s–1/2), where Ipa and Ipc are the anodic and cathodic peak currents, respectively. The Ip values were plotted relative to the square root of the scan rate (ν1/2) in Fig. 5B, which indicated that curcumin oxidation was dominated by the diffusion process. The peak currents of the redox system were proportional to the scan rate at higher scan rates (>0.1 V s–1), indicating a limitation owing to the electron-transfer kinetics. In this region, the peak separation increased, indicating that the surface reaction became irreversible with the increasing scan rate. For an irreversible electrode reaction, the relationship between the peak potential and scan rate follows Laviron’s law, as given below:25 Fig. 6 Plots of oxidation current vs. concentration of curcumin using various peaks in the CV profiles. The electrolyte used was 50 mM pH 6.0 citric acid buffer solution. concentration plots were IPeak I (μA) = 0.00 + 0.050[C] (μM), r = 0.999, with a linear range and sensitivity of 1.0 – 48.0 μM and 0.56 μA μM–1 cm–2, respectively; IPeak II (A) = 0.12 + 0.083[C] (μM), r = 0.999, with a linear range and sensitivity of 1.0 – 48.0 μM and 0.92 μA μM–1 cm–2, respectively; IPeak II′ (A) = 0.02–0.078[C] (μM), r=0.999, with a linear range and sensitivity of 1.0 – 48.0 μM and 0.87 μA μM–1 cm–2, respectively. The limit of detection (LOD) for curcumin was calculated using the following formula: LOD = 3S/M (where S is the standard deviation of blank and M is the slope of the calibration plot). The LOD for curcumin detection using the CV method was 0.084 μM. A comparative study of the curcumin-sensing properties of various electrodes is shown in Table 1. It is evident that the performance of the CNT-CMC electrode was similar to that of other reported electrodes. However, the method described in this study is simpler (drop-casting formation), more cost- effective (without other functional materials, such as metal nanoparticles), and easier to extend compared to previous methods. The specificity of our procedure is exemplified by the CV technique, whereas the other methods depend on differential pulse voltammetry or square-wave voltammetry. The advantage of CV is that (i) a repeat scan keeps the electrode surface clean and, consequently, the reproducibility is enhanced, which is an Epa = E0′ – Epc = E0′ + RT ln RTks + (1 – α)nF ((1 – α)nF ) RT ln(RTks )– RT ln ν αnF αnF αnF RT (1 – α)nF ln ν (2) (3) where, n, R, T, F, ks, and E0′ are the electron-transfer coefficient, electron number, gas constant, absolute temperature, Faraday constant, standard rate constant of the surface reaction, scan rate, and formal potential, respectively. E0′ is estimated for the midpoint between Epa and Epc at a lower scan rate. At a high scan rate, the plots of Ep vs. are linear and given by the following relationship (Fig. 5C): Epa (V) = +0.369 + 0.0207 ln ν (V/s) (r = 0.999) Epc (V) = +0.186 – 0.0211 ln ν (V/s) (r = 0.999) (4) (5) From Eqs. (2) and (4), (1 – α)n and ks were estimated to be 1.2 and 0.60 s–1, respectively. From Eqs. (3) and (5), n and ks were estimated to be 1.2 and 0.61 s–1, respectively. Quantification of curcumin in real sample The CV profiles of curcumin differed between the first and second cycles. Therefore, we adopted the peak of the third or higher scans for quantitative analysis. Plots of the peak current vs. concentrations of curcumin are shown in Fig. 6. Peaks I, II, and II′ were quantified as follows. The linear functions for curcumin determination using the peak current (Ipeak) vs.PDF Image | Electrochemical Detection of Curcumin
PDF Search Title:
Electrochemical Detection of CurcuminOriginal File Name Searched:
36_20P021.pdfDIY PDF Search: Google It | Yahoo | Bing
CO2 Organic Rankine Cycle Experimenter Platform The supercritical CO2 phase change system is both a heat pump and organic rankine cycle which can be used for those purposes and as a supercritical extractor for advanced subcritical and supercritical extraction technology. Uses include producing nanoparticles, precious metal CO2 extraction, lithium battery recycling, and other applications... More Info
Heat Pumps CO2 ORC Heat Pump System Platform More Info
| CONTACT TEL: 608-238-6001 Email: greg@infinityturbine.com | RSS | AMP |