PDF Publication Title:
Text from PDF Page: 003
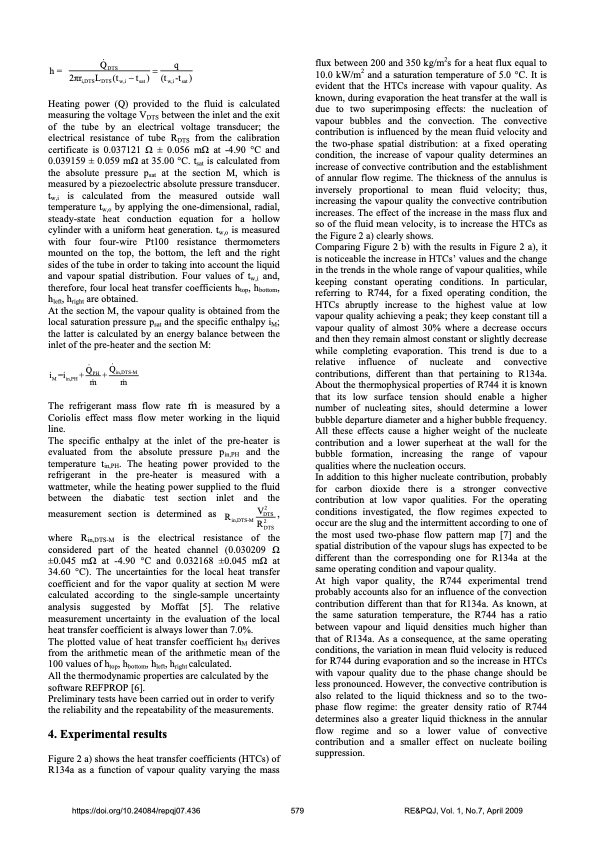
& h= QDTS =q 2πri,DTSLDTS (tw,i − tsat ) (tw,i -tsat ) Heating power (Q) provided to the fluid is calculated measuring the voltage VDTS between the inlet and the exit of the tube by an electrical voltage transducer; the electrical resistance of tube RDTS from the calibration certificate is 0.037121 Ω ± 0.056 mΩ at -4.90 °C and 0.039159 ± 0.059 mΩ at 35.00 °C. tsat is calculated from the absolute pressure psat at the section M, which is measured by a piezoelectric absolute pressure transducer. tw,i is calculated from the measured outside wall temperature tw,o by applying the one-dimensional, radial, steady-state heat conduction equation for a hollow cylinder with a uniform heat generation. tw,o is measured with four four-wire Pt100 resistance thermometers mounted on the top, the bottom, the left and the right sides of the tube in order to taking into account the liquid and vapour spatial distribution. Four values of tw,i and, therefore, four local heat transfer coefficients htop, hbottom, hleft, hright are obtained. At the section M, the vapour quality is obtained from the local saturation pressure psat and the specific enthalpy iM; the latter is calculated by an energy balance between the inlet of the pre-heater and the section M: The refrigerant mass flow rate m& is measured by a Coriolis effect mass flow meter working in the liquid line. The specific enthalpy at the inlet of the pre-heater is evaluated from the absolute pressure pin,PH and the temperature tin,PH. The heating power provided to the refrigerant in the pre-heater is measured with a wattmeter, while the heating power supplied to the fluid between the diabatic test section inlet and the flux between 200 and 350 kg/m2s for a heat flux equal to 10.0 kW/m2 and a saturation temperature of 5.0 °C. It is evident that the HTCs increase with vapour quality. As known, during evaporation the heat transfer at the wall is due to two superimposing effects: the nucleation of vapour bubbles and the convection. The convective contribution is influenced by the mean fluid velocity and the two-phase spatial distribution: at a fixed operating condition, the increase of vapour quality determines an increase of convective contribution and the establishment of annular flow regime. The thickness of the annulus is inversely proportional to mean fluid velocity; thus, increasing the vapour quality the convective contribution increases. The effect of the increase in the mass flux and so of the fluid mean velocity, is to increase the HTCs as the Figure 2 a) clearly shows. Comparing Figure 2 b) with the results in Figure 2 a), it is noticeable the increase in HTCs’ values and the change in the trends in the whole range of vapour qualities, while keeping constant operating conditions. In particular, referring to R744, for a fixed operating condition, the HTCs abruptly increase to the highest value at low vapour quality achieving a peak; they keep constant till a vapour quality of almost 30% where a decrease occurs and then they remain almost constant or slightly decrease while completing evaporation. This trend is due to a relative influence of nucleate and convective contributions, different than that pertaining to R134a. About the thermophysical properties of R744 it is known that its low surface tension should enable a higher number of nucleating sites, should determine a lower bubble departure diameter and a higher bubble frequency. All these effects cause a higher weight of the nucleate contribution and a lower superheat at the wall for the bubble formation, increasing the range of vapour qualities where the nucleation occurs. In addition to this higher nucleate contribution, probably for carbon dioxide there is a stronger convective contribution at low vapor qualities. For the operating && iM=iin,PH+QPH +Qin,DTS-M m& m& measurement section is determined as R DTS , in,DTS-M R2DTS where Rin,DTS-M is the electrical resistance of the considered part of the heated channel (0.030209 Ω ±0.045 mΩ at -4.90 °C and 0.032168 ±0.045 mΩ at 34.60 °C). The uncertainties for the local heat transfer coefficient and for the vapor quality at section M were calculated according to the single-sample uncertainty analysis suggested by Moffat [5]. The relative measurement uncertainty in the evaluation of the local heat transfer coefficient is always lower than 7.0%. The plotted value of heat transfer coefficient hM derives from the arithmetic mean of the arithmetic mean of the 100 values of htop, hbottom, hleft, hright calculated. All the thermodynamic properties are calculated by the software REFPROP [6]. Preliminary tests have been carried out in order to verify the reliability and the repeatability of the measurements. 4. Experimental results Figure 2 a) shows the heat transfer coefficients (HTCs) of R134a as a function of vapour quality varying the mass occur are the slug and the intermittent according to one of the most used two-phase flow pattern map [7] and the spatial distribution of the vapour slugs has expected to be different than the corresponding one for R134a at the same operating condition and vapour quality. At high vapor quality, the R744 experimental trend probably accounts also for an influence of the convection contribution different than that for R134a. As known, at the same saturation temperature, the R744 has a ratio between vapour and liquid densities much higher than that of R134a. As a consequence, at the same operating conditions, the variation in mean fluid velocity is reduced for R744 during evaporation and so the increase in HTCs with vapour quality due to the phase change should be less pronounced. However, the convective contribution is also related to the liquid thickness and so to the two- phase flow regime: the greater density ratio of R744 determines also a greater liquid thickness in the annular flow regime and so a lower value of convective contribution and a smaller effect on nucleate boiling suppression. https://doi.org/10.24084/repqj07.436 579 RE&PQJ, Vol. 1, No.7, April 2009 V2 conditions investigated, the flow regimes expected toPDF Image | Comparison of R744 and R134a
PDF Search Title:
Comparison of R744 and R134aOriginal File Name Searched:
436-mastrullo.pdfDIY PDF Search: Google It | Yahoo | Bing
CO2 Organic Rankine Cycle Experimenter Platform The supercritical CO2 phase change system is both a heat pump and organic rankine cycle which can be used for those purposes and as a supercritical extractor for advanced subcritical and supercritical extraction technology. Uses include producing nanoparticles, precious metal CO2 extraction, lithium battery recycling, and other applications... More Info
Heat Pumps CO2 ORC Heat Pump System Platform More Info
| CONTACT TEL: 608-238-6001 Email: greg@infinityturbine.com | RSS | AMP |