PDF Publication Title:
Text from PDF Page: 039
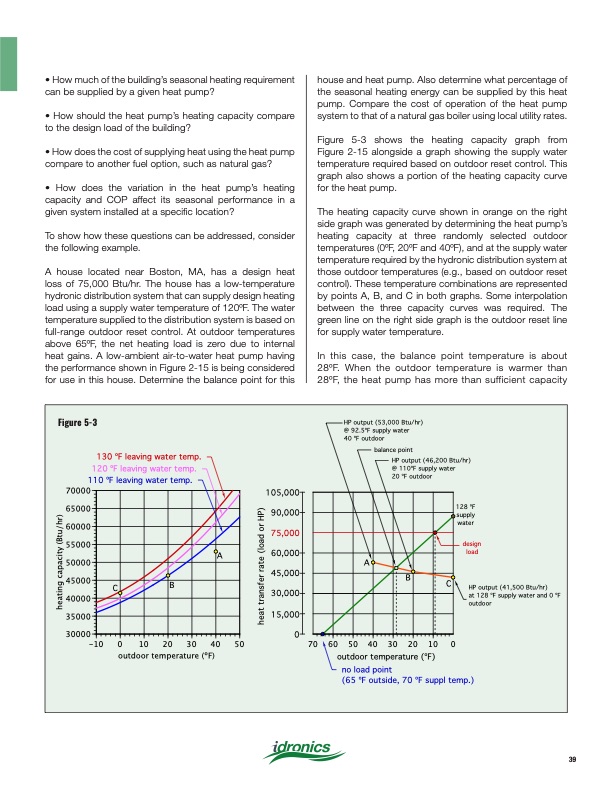
Figure 5-3 130 oF leaving water temp. 120 oF leaving water temp. 110 oF leaving water temp. 70000 65000 60000 55000 50000 45000 40000 35000 30000 -10 105,000 90,000 75,000 60,000 45,000 30,000 15,000 0 HP output (53,000 Btu/hr) @ 92.5oF supply water 40 oF outdoor balance point HP output (46,200 Btu/hr) @ 110oF supply water 20 oF outdoor 128 oF supply water design load HP output (41,500 Btu/hr) at 128 oF supply water and 0 oF outdoor A C B A B C 0 outdoor temperature (oF) 10 20 30 40 50 70 60 50 40 30 20 10 0 outdoor temperature (oF) no load point (65 oF outside, 70 oF suppl temp.) • How much of the building’s seasonal heating requirement can be supplied by a given heat pump? • How should the heat pump’s heating capacity compare to the design load of the building? • How does the cost of supplying heat using the heat pump compare to another fuel option, such as natural gas? • How does the variation in the heat pump’s heating capacity and COP affect its seasonal performance in a given system installed at a specific location? To show how these questions can be addressed, consider the following example. A house located near Boston, MA, has a design heat loss of 75,000 Btu/hr. The house has a low-temperature hydronic distribution system that can supply design heating load using a supply water temperature of 120oF. The water temperature supplied to the distribution system is based on full-range outdoor reset control. At outdoor temperatures above 65oF, the net heating load is zero due to internal heat gains. A low-ambient air-to-water heat pump having the performance shown in Figure 2-15 is being considered for use in this house. Determine the balance point for this house and heat pump. Also determine what percentage of the seasonal heating energy can be supplied by this heat pump. Compare the cost of operation of the heat pump system to that of a natural gas boiler using local utility rates. Figure 5-3 shows the heating capacity graph from Figure 2-15 alongside a graph showing the supply water temperature required based on outdoor reset control. This graph also shows a portion of the heating capacity curve for the heat pump. The heating capacity curve shown in orange on the right side graph was generated by determining the heat pump’s heating capacity at three randomly selected outdoor temperatures (0oF, 20oF and 40oF), and at the supply water temperature required by the hydronic distribution system at those outdoor temperatures (e.g., based on outdoor reset control). These temperature combinations are represented by points A, B, and C in both graphs. Some interpolation between the three capacity curves was required. The green line on the right side graph is the outdoor reset line for supply water temperature. In this case, the balance point temperature is about 28oF. When the outdoor temperature is warmer than 28oF, the heat pump has more than sufficient capacity 39 heating capacity (Btu/hr) heat transfer rate (load or HP)PDF Image | Heat Pump Systems 2020
PDF Search Title:
Heat Pump Systems 2020Original File Name Searched:
idronics_27_na.pdfDIY PDF Search: Google It | Yahoo | Bing
CO2 Organic Rankine Cycle Experimenter Platform The supercritical CO2 phase change system is both a heat pump and organic rankine cycle which can be used for those purposes and as a supercritical extractor for advanced subcritical and supercritical extraction technology. Uses include producing nanoparticles, precious metal CO2 extraction, lithium battery recycling, and other applications... More Info
Heat Pumps CO2 ORC Heat Pump System Platform More Info
| CONTACT TEL: 608-238-6001 Email: greg@infinityturbine.com | RSS | AMP |