PDF Publication Title:
Text from PDF Page: 010
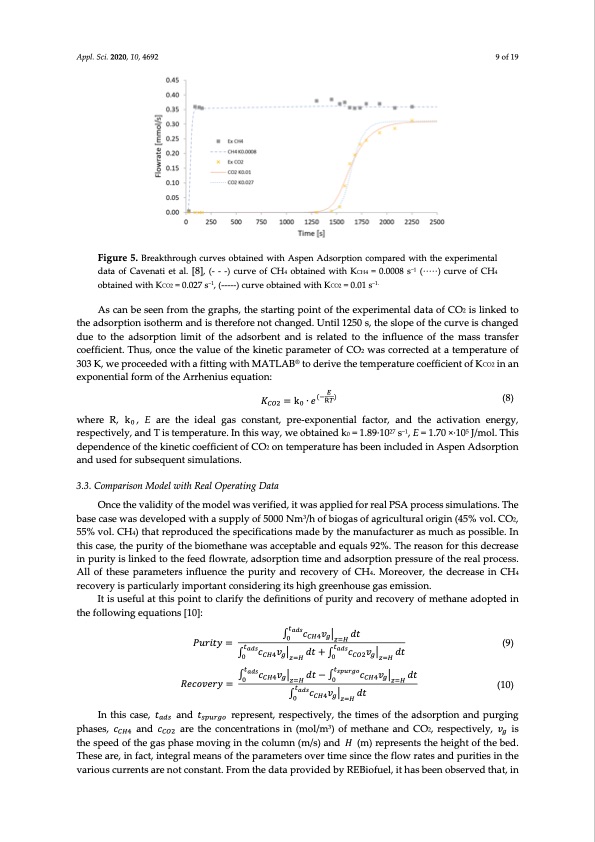
Appl. Sci. 2020, 10, 4692 9 of 19 Figure 5. Breakthrough curves obtained with Aspen Adsorption compared with the experimental data of Cavenati et al. [8], (- - -) curve of CH4 obtained with KCH4 = 0.0008 s−1 (∙∙∙∙∙) curve of CH4 obtained with KCO2 = 0.027 s−1, (-----) curve obtained with KCO2 = 0.01 s−1. As can be seen from the graphs, the starting point of the experimental data of CO2 is linked to the adsorption isotherm and is therefore not changed. Until 1250 s, the slope of the curve is changed due to the adsorption limit of the adsorbent and is related to the influence of the mass transfer coefficient. Thus, once the value of the kinetic parameter of CO2 was corrected at a temperature of 303 K, we proceeded with a fitting with MATLAB® to derive the temperature coefficient of KCO2 in an exponential form of the Arrhenius equation: 𝑃𝑢𝑟𝑖𝑡𝑦 = 𝑐𝑣 𝑑𝑡 𝑐𝑣 𝑑𝑡 + 𝑐𝑣 𝑑𝑡 (9) (10) ( ) 𝐾=k∙𝑒 (8) where R, k , E are the ideal gas constant, pre-exponential factor, and the activation energy, respectively, and T is temperature. In this way, we obtained k0 = 1.89∙1027 s−1, E = 1.70 ×∙105 J/mol. This dependence of the kinetic coefficient of CO2 on temperature has been included in Aspen Adsorption and used for subsequent simulations. 3.3. Comparison Model with Real Operating Data Once the validity of the model was verified, it was applied for real PSA process simulations. The base case was developed with a supply of 5000 Nm3/h of biogas of agricultural origin (45% vol. CO2, 55% vol. CH4) that reproduced the specifications made by the manufacturer as much as possible. In this case, the purity of the biomethane was acceptable and equals 92%. The reason for this decrease in purity is linked to the feed flowrate, adsorption time and adsorption pressure of the real process. All of these parameters influence the purity and recovery of CH4. Moreover, the decrease in CH4 recovery is particularly important considering its high greenhouse gas emission. It is useful at this point to clarify the definitions of purity and recovery of methane adopted in the following equations [10]: 𝑐𝑣 𝑑𝑡 − 𝑐𝑣 𝑅𝑒𝑐𝑜𝑣𝑒𝑟𝑦= 𝑐𝑣 𝑑𝑡 𝑑𝑡 In this case, 𝑡 and 𝑡 represent, respectively, the times of the adsorption and purging phases, 𝑐 and 𝑐 are the concentrations in (mol/m3) of methane and CO2, respectively, 𝑣 is the speed of the gas phase moving in the column (m/s) and 𝐻 (m) represents the height of the bed. These are, in fact, integral means of the parameters over time since the flow rates and purities in the various currents are not constant. From the data provided by REBiofuel, it has been observed that, inPDF Image | Biogas Six-Step Pressure Swing Adsorption
PDF Search Title:
Biogas Six-Step Pressure Swing AdsorptionOriginal File Name Searched:
applsci-10-04692.pdfDIY PDF Search: Google It | Yahoo | Bing
CO2 Organic Rankine Cycle Experimenter Platform The supercritical CO2 phase change system is both a heat pump and organic rankine cycle which can be used for those purposes and as a supercritical extractor for advanced subcritical and supercritical extraction technology. Uses include producing nanoparticles, precious metal CO2 extraction, lithium battery recycling, and other applications... More Info
Heat Pumps CO2 ORC Heat Pump System Platform More Info
| CONTACT TEL: 608-238-6001 Email: greg@infinityturbine.com | RSS | AMP |