PDF Publication Title:
Text from PDF Page: 016
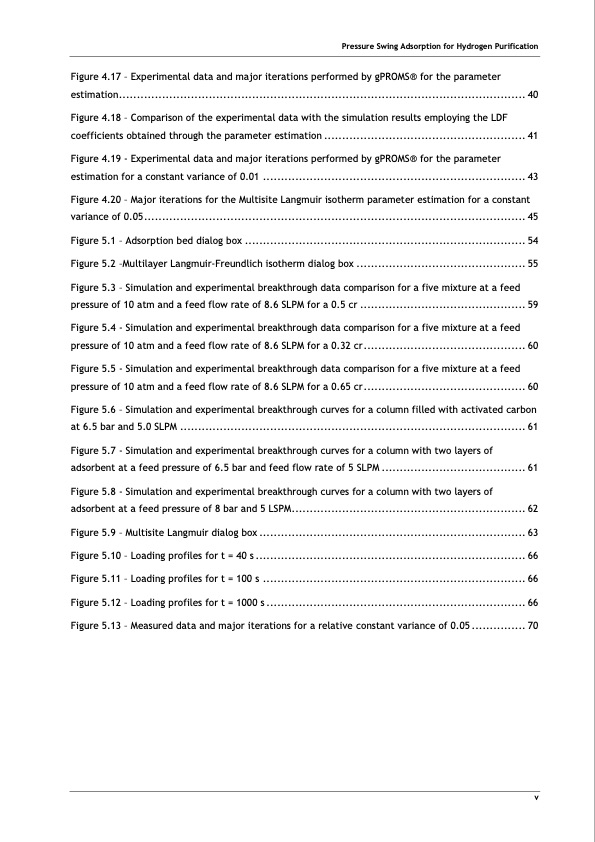
Figure 4.17 – Experimental data and major iterations performed by gPROMS® for the parameter estimation................................................................................................................. 40 Figure 4.18 – Comparison of the experimental data with the simulation results employing the LDF coefficients obtained through the parameter estimation ........................................................ 41 Figure 4.19 - Experimental data and major iterations performed by gPROMS® for the parameter estimation for a constant variance of 0.01 ......................................................................... 43 Figure 4.20 – Major iterations for the Multisite Langmuir isotherm parameter estimation for a constant variance of 0.05.......................................................................................................... 45 Figure 5.1 – Adsorption bed dialog box .............................................................................. 54 Figure 5.2 –Multilayer Langmuir-Freundlich isotherm dialog box ............................................... 55 Figure 5.3 – Simulation and experimental breakthrough data comparison for a five mixture at a feed pressure of 10 atm and a feed flow rate of 8.6 SLPM for a 0.5 cr .............................................. 59 Figure 5.4 - Simulation and experimental breakthrough data comparison for a five mixture at a feed pressure of 10 atm and a feed flow rate of 8.6 SLPM for a 0.32 cr ............................................. 60 Figure 5.5 - Simulation and experimental breakthrough data comparison for a five mixture at a feed pressure of 10 atm and a feed flow rate of 8.6 SLPM for a 0.65 cr ............................................. 60 Figure 5.6 – Simulation and experimental breakthrough curves for a column filled with activated carbon at 6.5 bar and 5.0 SLPM ................................................................................................ 61 Figure 5.7 - Simulation and experimental breakthrough curves for a column with two layers of adsorbent at a feed pressure of 6.5 bar and feed flow rate of 5 SLPM ........................................ 61 Figure 5.8 - Simulation and experimental breakthrough curves for a column with two layers of adsorbent at a feed pressure of 8 bar and 5 LSPM................................................................. 62 Figure 5.9 – Multisite Langmuir dialog box .......................................................................... 63 Figure 5.10 – Loading profiles for t = 40 s ........................................................................... 66 Figure 5.11 – Loading profiles for t = 100 s ......................................................................... 66 Figure 5.12 – Loading profiles for t = 1000 s ........................................................................ 66 Figure 5.13 – Measured data and major iterations for a relative constant variance of 0.05 ............... 70 Pressure Swing Adsorption for Hydrogen Purification vPDF Image | PRESSURE SWING ADSORPTION FOR THE PURIFICATION OF HYDROGEN

PDF Search Title:
PRESSURE SWING ADSORPTION FOR THE PURIFICATION OF HYDROGENOriginal File Name Searched:
32541.pdfDIY PDF Search: Google It | Yahoo | Bing
CO2 Organic Rankine Cycle Experimenter Platform The supercritical CO2 phase change system is both a heat pump and organic rankine cycle which can be used for those purposes and as a supercritical extractor for advanced subcritical and supercritical extraction technology. Uses include producing nanoparticles, precious metal CO2 extraction, lithium battery recycling, and other applications... More Info
Heat Pumps CO2 ORC Heat Pump System Platform More Info
| CONTACT TEL: 608-238-6001 Email: greg@infinityturbine.com | RSS | AMP |